Two teams test the same checkout with 100 threads. One reports a 95% line of 900 ms and calls it ready. The other reports 4,800 ms with 6% errors and blocks the release. Both ran JMeter correctly. They just set three fields differently: ramp-up, think time and pacing.
This guide explains what each setting does to the load your server actually receives, how each one can quietly distort your results, and how to set them so your numbers describe real users.
Threads are not load: the formula behind all three
A JMeter thread is a loop: send a request, wait for the response, pause, repeat. How many requests per second it produces depends on how long each loop takes. That relationship is Little's Law:
Throughput = Threads ÷ (Response time + Think time)
Take 100 threads and a 0.5-second response time (example numbers):
- With 4.5 s think time: 100 ÷ (0.5 + 4.5) = 20 req/s.
- With no think time: 100 ÷ 0.5 = 200 req/s. Same thread count, 10× the load.
So "we tested with 100 users" says almost nothing on its own. Ramp-up controls when those threads start, think time controls how hard each one pushes, and pacing controls whether the load stays fixed when the server slows down.
Ramp-up: how fast the users arrive
The Ramp-up period in a Thread Group is the time JMeter takes to start all threads. 100 threads with a 100-second ramp-up start one new thread per second.
Too short (or zero) and every user hits the server in the same second. Caches are cold, connection pools are still being created, and the JIT compiler hasn't warmed up. You get a spike of slow responses and errors in the first minute that real traffic rarely produces — and those early samples pull up your average and 99% line for the whole run.
Too long and the test spends most of its time at partial load. If the ramp-up is 20 minutes and the test is 30, two-thirds of your samples were taken with fewer users than you planned. The percentiles then mix light and heavy load into one misleading number. Worse, if each thread runs only a few loops, early threads can finish before the last ones start, and you never reach full concurrency at all.
How to pick it:
- Ramp up fast enough to reach full load within 10–20% of the test duration.
- Hold the full load long enough to measure: at least 10–15 minutes of steady state for a load test.
- Use Duration (the Thread Group's scheduler) instead of a loop count, so threads keep running until the test ends.
- Analyze the steady-state window only. The ramp-up is warm-up, not results.
Think time: how long a user pauses
Real users read a page, fill in a form, compare prices. Think time is that pause between requests. In JMeter you add it with a Timer: Constant Timer for a fixed pause, Uniform Random Timer or Gaussian Random Timer for a realistic spread.
No think time turns every thread into a machine firing requests back to back. As the formula showed, 100 threads with no pauses can generate the load of 1,000 real users. Your test will find a bottleneck, but it describes a crowd that doesn't exist, and you may size infrastructure for a peak you'll never see.
Too much think time has the opposite effect: the server is barely busy and every number looks great.
How to set it:
- Take it from production. Analytics or access logs show how long users stay on each page. Use that average, with a random spread around it.
- Put timers where users actually pause (after a page loads), not inside a burst of API calls a browser makes in parallel.
- Check one accuracy trap: the Transaction Controller option "Include duration of timer and pre-post processors in generated sample" should normally stay unchecked. If it's on, your think time is added to the transaction's response time, and a 600 ms page reports as 5 seconds.
Pacing: keeping the load fixed when the server slows down
Think time is a pause after each request. Pacing is a target for each iteration: "start a new checkout every 6 seconds, however long the last one took." The difference only shows up when the server gets slow — which is exactly when it matters.
Without pacing, a slow server slows the test down. If response time doubles, each thread loops less often, so the load drops just as the system struggles. The server gets breathing room real users would never give it, and the results look better than reality. This effect is often called coordinated omission: the test stops sending exactly the requests that would have been slow.
With pacing, the arrival rate stays fixed. When the server slows, requests queue up, response times climb and errors appear — the same thing production would see.
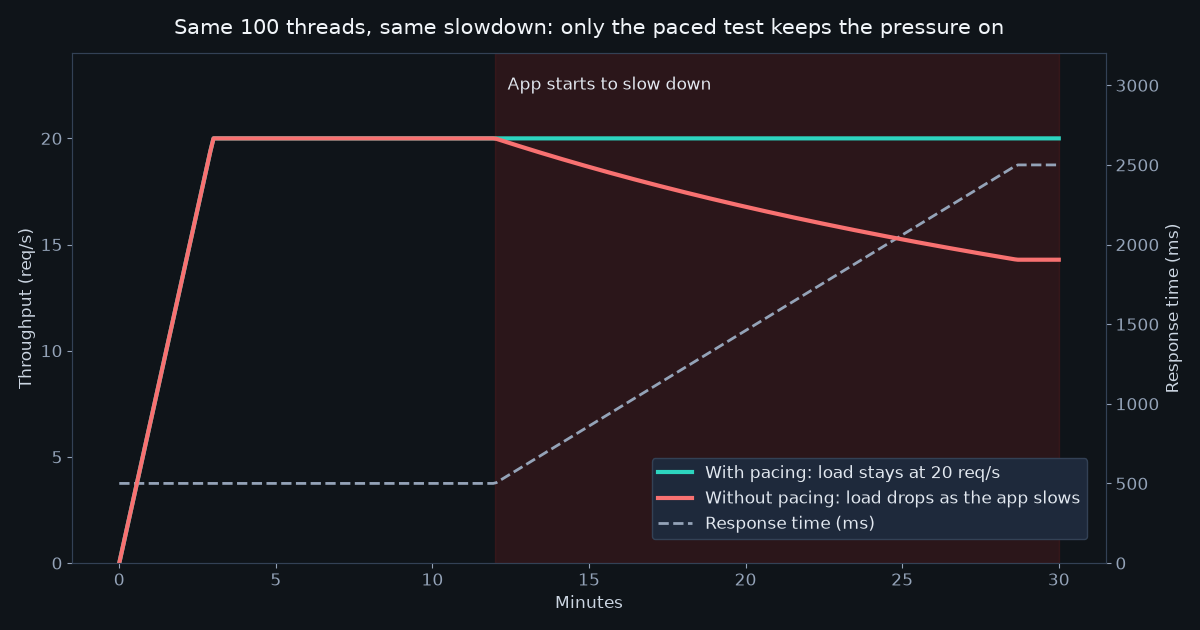
Illustrative: 100 threads, 4.5 s think time. When response time climbs from 0.5 s to 2.5 s, the unpaced test quietly falls from 20 to about 14 req/s.
Ways to pace in JMeter:
| Tool | What it does | Watch out for |
|---|---|---|
| Constant Throughput Timer | Delays samplers to hold a target rate (samples per minute) | Can only slow threads down, never speed them up |
| Precise Throughput Timer | Holds a target rate with even, randomized spacing | Same: needs enough threads to reach the target |
| Open Model Thread Group (JMeter 5.5+) | Starts new threads at a set arrival rate, independent of response time | Thread count can grow fast if the server stalls |
| Throughput Shaping Timer (plugin) | Follows a rate schedule: steps, peaks, ramps | Requires the JMeter Plugins Manager |
Each of these can only hold a rate if enough threads are free. Size the pool with the same formula: threads ≥ target throughput × (response time + think time), plus headroom for when response times grow.
One app, four test setups
Here is the same checkout tested four ways. The app handles about 150 req/s before it saturates, and a request takes 0.5 s when it isn't busy. These are illustrative numbers, but the pattern is what you'll see in real runs.
| Setup | Load reached | 95% line | Error % | What the results really describe |
|---|---|---|---|---|
| A. 100 threads, 0 s ramp-up, no think time | ~150 req/s (capped) | 4,800 ms | 6.0% | Overload plus a cold start. Closer to 1,000 users than 100. |
| B. 100 threads, 100 s ramp-up, no think time | ~150 req/s (capped) | 2,700 ms | 2.1% | The app's maximum throughput. Useful as a stress test, not as "100 users". |
| C. 100 threads, 100 s ramp-up, 4.5 s think time | ~20 req/s | 900 ms | 0.0% | 100 real users browsing. Accurate, if that's your peak. |
| D. 1,000 threads, 10 min ramp-up, 4.5 s think time, paced | ~150 req/s (target 200) | 5,200 ms | 7.4% | 1,000 real users. The app can't keep up, and the test shows it honestly. |
The two teams from the intro ran setups A and C. Both told the truth about their test. Only one of them told the truth about their users. Notice that A and D look alike: an unrealistic 100-user test accidentally measured something close to a 1,000-user peak, then reported it under the wrong name.
How to spot these mistakes in your results
You don't need the test plan to catch most of these. The charts give them away.
| What you see | Likely cause | Fix |
|---|---|---|
| A spike of slow responses and errors in the first minute, then calm | Ramp-up too short | Lengthen the ramp-up; leave the warm-up out of the analysis |
| Active threads still climbing when the test ends | Ramp-up too long, or test too short | Shorten the ramp-up or extend the steady state |
| Active threads drop before the end | Loop count too low: threads finished early | Use a Duration instead of loops |
| Throughput far above what production ever sees | Missing or too-short think time | Add timers based on real user behavior |
| Throughput falls whenever response time rises | No pacing: the test backs off when the app slows | Add a throughput timer or use an open-model thread group |
| Transaction times include seconds of "nothing" | Timer duration counted inside the Transaction Controller | Uncheck the include-timers option |
In JMeterHub, put the Response times over time chart next to Throughput & active threads. A healthy run shows threads flattening after the ramp-up, throughput flattening with them, and response times holding steady. Any line that keeps drifting is the first thing to explain.
Checklist before you press Start
- Write down the target load in requests per second, not just a thread count. Take it from production peaks.
- Work out the threads you need: target throughput × (response time + think time), plus 20–30% headroom.
- Set think time from real user behavior, with a random spread, at the points where users actually pause.
- Decide whether you need pacing. If the question is "what happens at 200 req/s?", pace it. If it's "what's the maximum?", don't.
- Ramp up within 10–20% of the test, then hold steady state for at least 10–15 minutes.
- Run by duration, not loop count.
- Report the steady-state window, and say how the load was generated: threads, think time, pacing, ramp-up. A 95% line without that context can't be compared to anything.
Try it on your own results
Open your .jtl file in the JMeterHub analyzer — it runs entirely in your browser, nothing leaves your machine. Compare the response-time and active-threads charts to see whether your ramp-up and pacing held up, and run a baseline-vs-new comparison after you change them.
No file handy? Open the Soak test demo or the Black Friday spike demo and look at how threads, throughput and latency move together.
Lifetime Pro is free for accounts created before November 27 — saved analyses, PDF reports and AI conclusions included. Claim lifetime Pro