One p95 target for every transaction rarely fits. Login can afford 800 ms, search needs 300 ms, and a nightly export can take seconds. And comparing a single "before" and "after" doesn't tell you whether a slowdown is new or has been building for weeks. This update fixes both.
Compare up to 6 runs
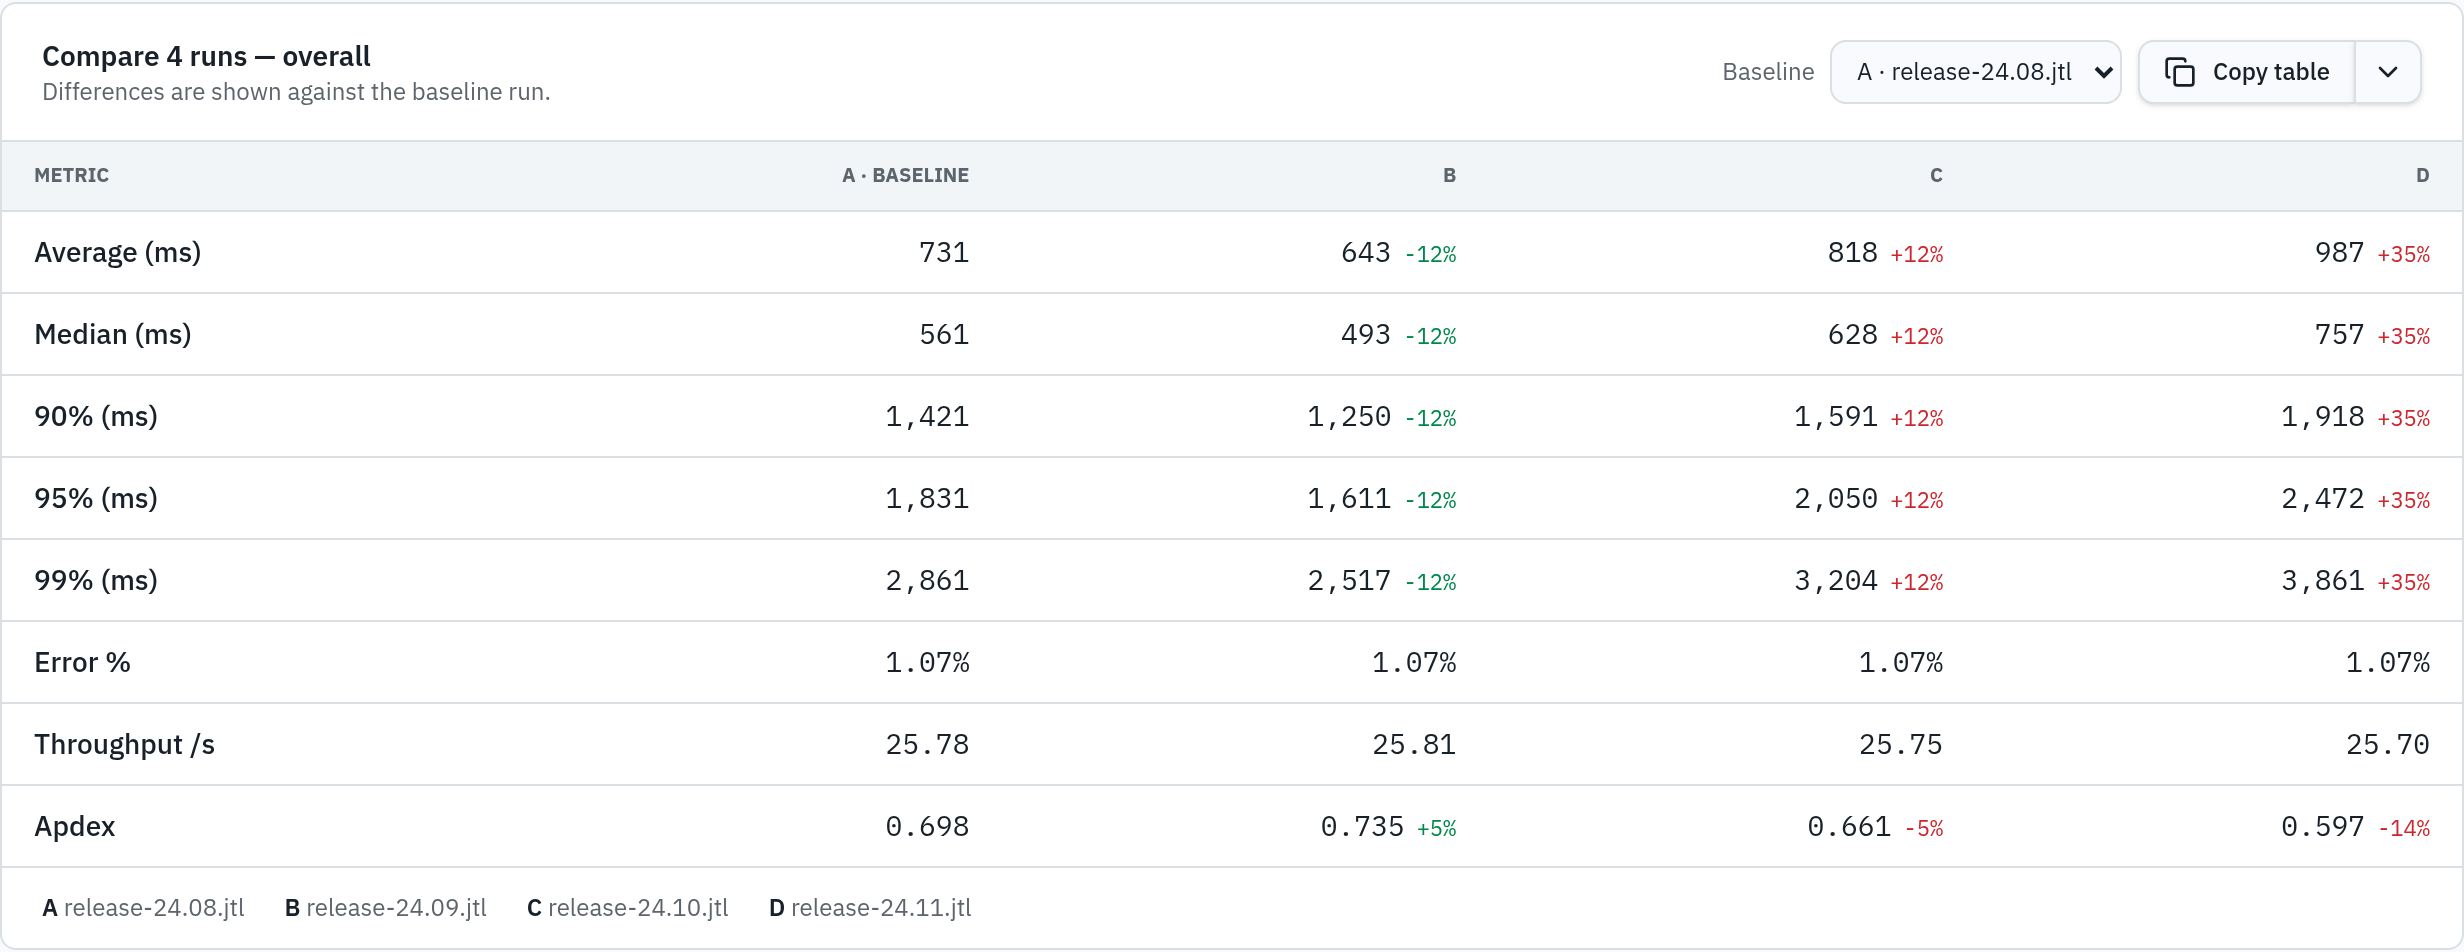
Open up to six result files side by side. Pick any one as the baseline, and every other run shows how much it changed for each transaction, in green when it got faster and red when it got slower. You can spot a slow drift across releases at a glance, not only a single jump.
A baseline for each project
Mark one saved analysis as the project baseline from your dashboard, and it gets a star. When you open a new run, load that baseline in one click, so every comparison starts from the same agreed reference.
SLA targets per transaction
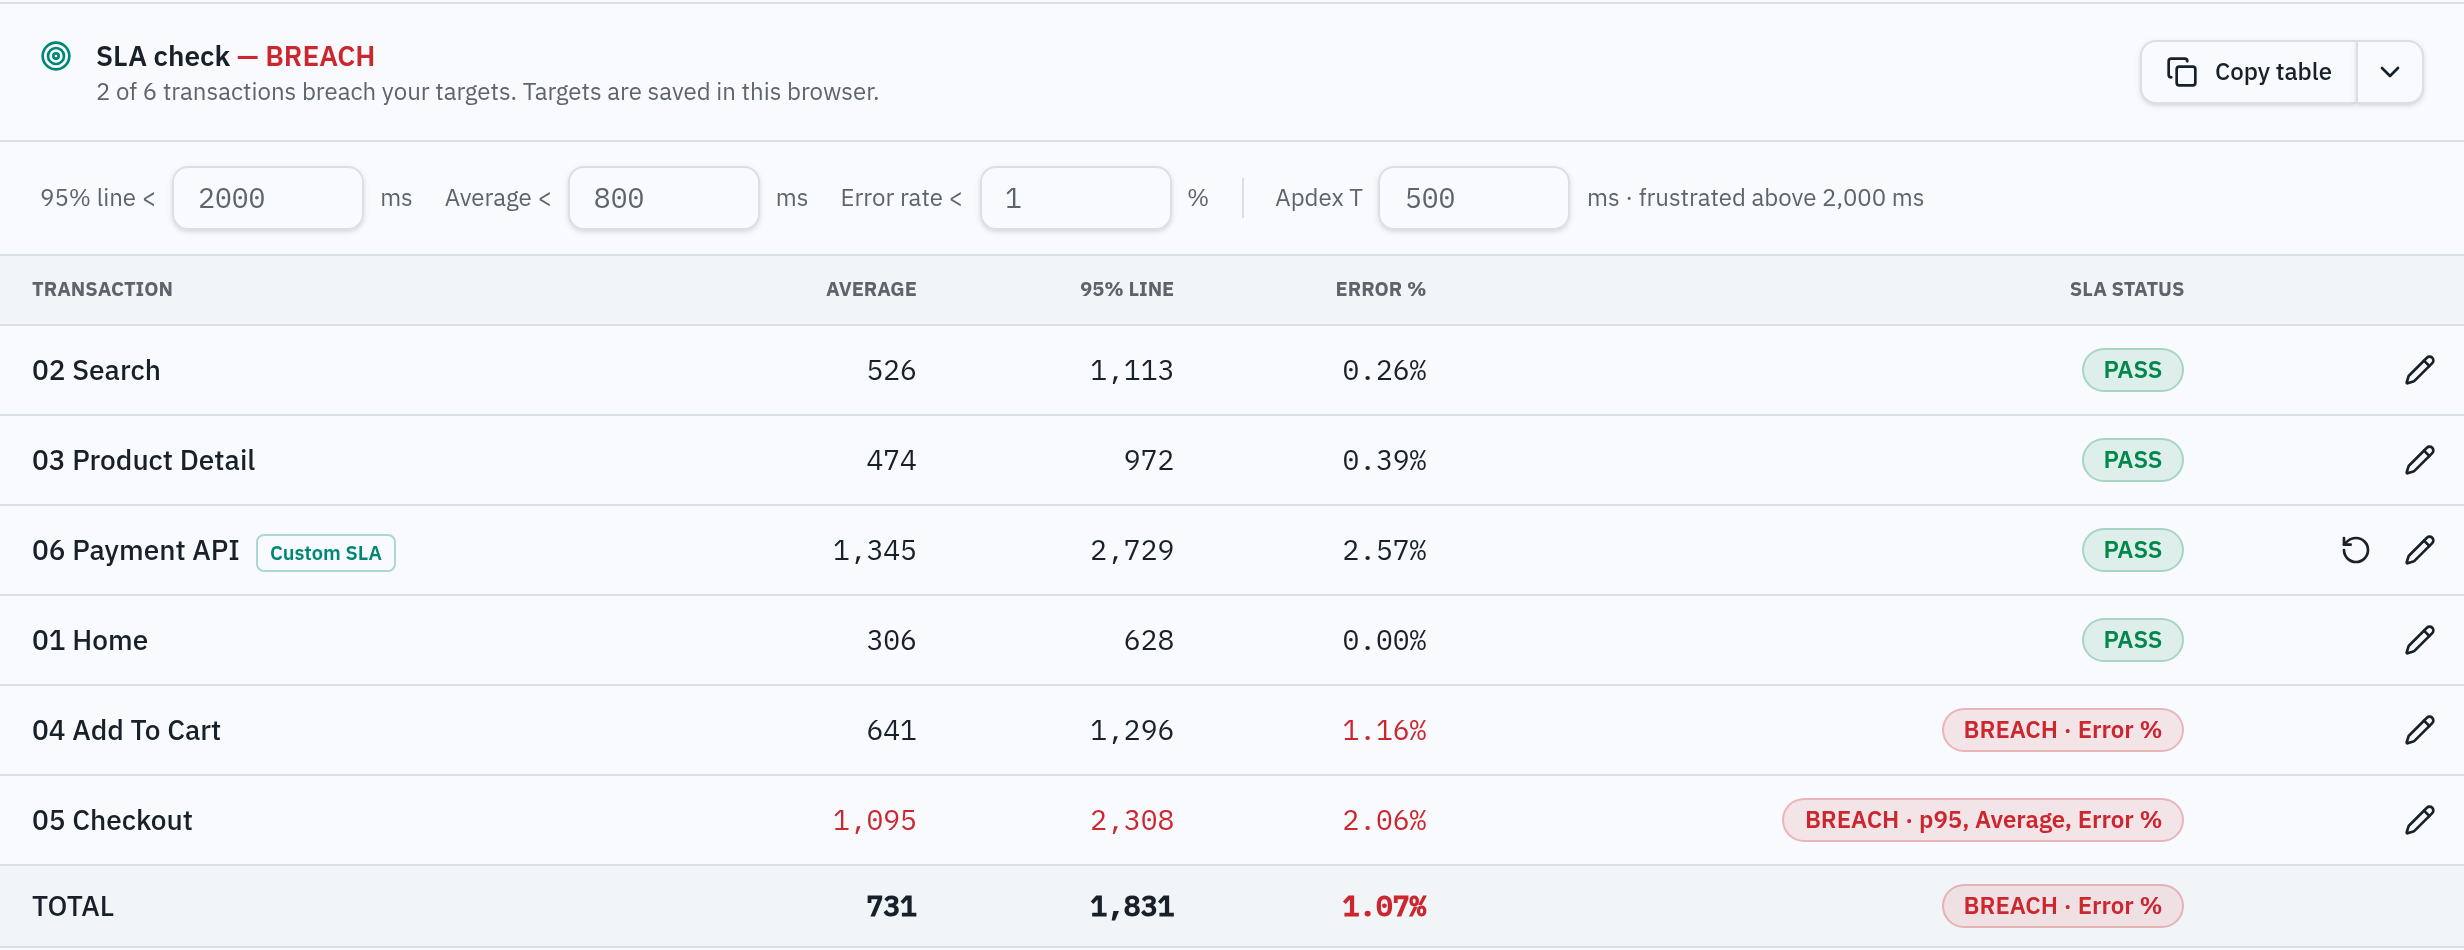
Nothing was taken away: the free SLA check works as before — one set of targets for the 95% line, average and error rate, applied to every transaction. Pro adds the option to give individual transactions their own 95% line, average and error-rate targets (for example a looser target for a slow payment call). Edit them inline; edited transactions are marked Custom SLA, and one click puts them back on the global targets. The PASS/BREACH badges and the PDF follow your targets.
Set your own Apdex threshold
Apdex counts a response as "satisfied" below a threshold T, which JMeter sets to 500 ms by default. If your users judge your app differently, change T, and the Apdex score for files you've opened in this session is recalculated straight away. Saved analyses keep the Apdex they were saved with.
Ask the AI about this report
Open the question panel under any run to get clear answers to the questions you'd ask anyway:
- Verdict: Did this run pass? Which SLAs failed, and by how much? Which 3 transactions are the biggest bottlenecks?
- Errors (when there are any): What's causing them? Did they start at a certain load?
- Capacity and stability: When did response times start climbing? Does throughput keep growing? Does performance stay steady throughout the run?
- Comparison (with a baseline): What got slower, and is it a real change or noise? What got faster?
- Next steps: What should you check first on the server? Is the test valid? A short summary for your manager or client.
Questions that only need math, like the verdict and the slower or faster lists, are calculated directly from your numbers. Everything else is answered in one go when you open the panel.
Paid Pro includes unlimited questions. Early Adopters get 2 report Q&As per day, plus their 2 daily AI conclusions.
Who gets what
| Free | Pro | |
|---|---|---|
| Analysis, charts, two-run comparison, global SLA check | Included | Included |
| Compare up to 6 runs, project baselines | — | Included |
| Per-transaction SLAs, configurable Apdex | — | Included |
| AI conclusions and Ask the AI | — | Unlimited on paid · 2/day each for Early Adopters |
Try it
Open the analyzer with your own results or the Black Friday demo. The Early Adopter offer ends November 27, 2026: join before then to keep Pro free for life. After that, Pro is $5/month. See plans.